Selected Recent Projects
Startup & Funding
A scrolly-telling visual
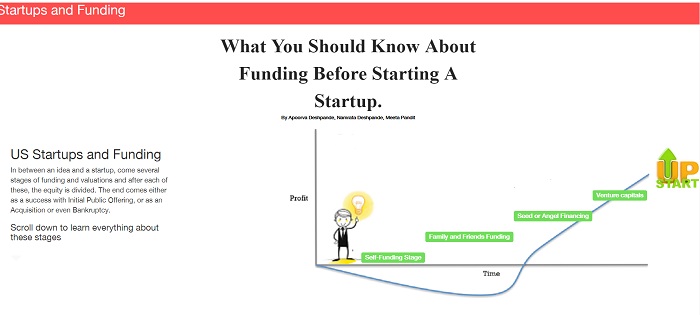
Startups are very important for the growth of an economy. This project uses a visual story-telling project approach to help new entrepreneurs to learn about funding process in US. Data Analysis was performed on data provided by Crunchbase, Quandl.com and Kauffman.org to describe the different steps in startup funding along with description of current statistics.
Data Analysis Interactive UI D3 VisualizationView Visualization Download Report
Prediction of Titanic Survivors
A comparison between statistical models
This project focuses on evaluating the performances of different statistical learning methods for prediction using R programming language. The models would be fitted over Titanic dataset that contains different variables related to demographics and other information about the passengers along with whether they survived or not.
Statistical Models Predictive Analysis R Machine LearningView Project
Nearest Neighbor Algorithm (from scratch)
Machine Learning Algorithms Implementation
Implementation of nearest neighbor and KNN from scratch along with testing the written algorithm on Boston dataset. Cross-validation is also implemented from scratch to optimize the model.
Statistical Models Optimization Python Machine LearningView Project
Analysis of causal effects of Progresa
Causality Analysis in Python
Analysed causal effects of Progresa program used in Mexico in 1997 on school enrolments using counter-factual assumptions. Simple and multiple regression along with difference in differences techniques similar to those described in the paper "School subsidies for the poor: evaluating the Mexican Progresa poverty program", by Paul Shultz are used in Python to evaluate the relationships.
Statistical Models Causal Analysis Python Machine LearningView Project
NutritionFinder
An interactive D3 Tool
An interactive tool to find out the actual nutritional composition of food that we eat in normal life. Analyzed the data from US Department of Agriculture, Agricultural Research Service, Nutrient Data Laboratory to create the interactive tool using D3.js, HTML, JavaScript and Bootstrap
Data Analysis Visualization D3 InteractiveView Visualization
Women in STEM: By the numbers
A Data Analysis and Visualization Report
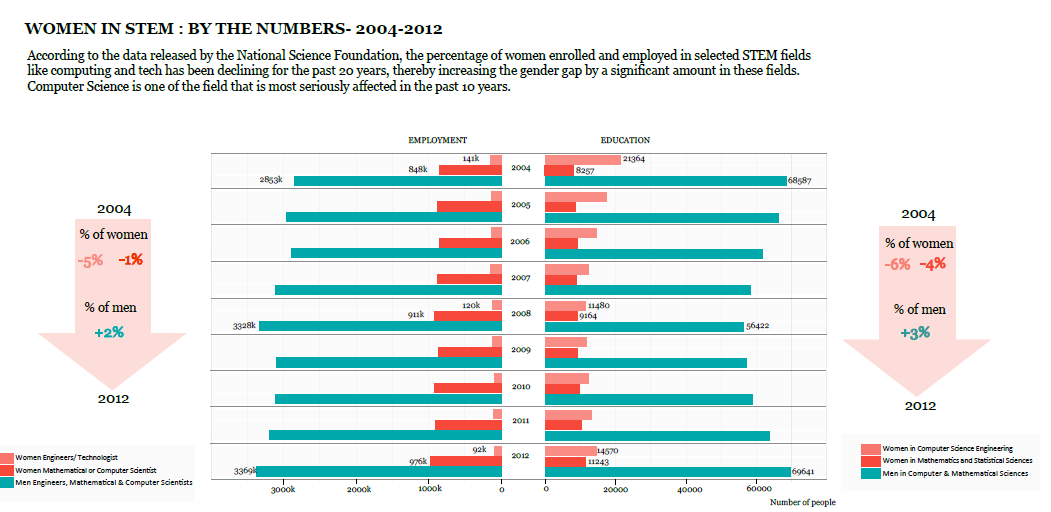
Although women constitute about half of the US labor force (47%), only 25% of them are currently employed in STEM. The project focuses on the current statistics for gender disparity in STEM and explore the reasons behind it along with suggesting some probable steps that could be taken to overcome the disparity
Data Analysis Visualization R Adobe IllustratorView Visualization Download Report
Housing Prices in Boston Suburbs
A Shiny Application
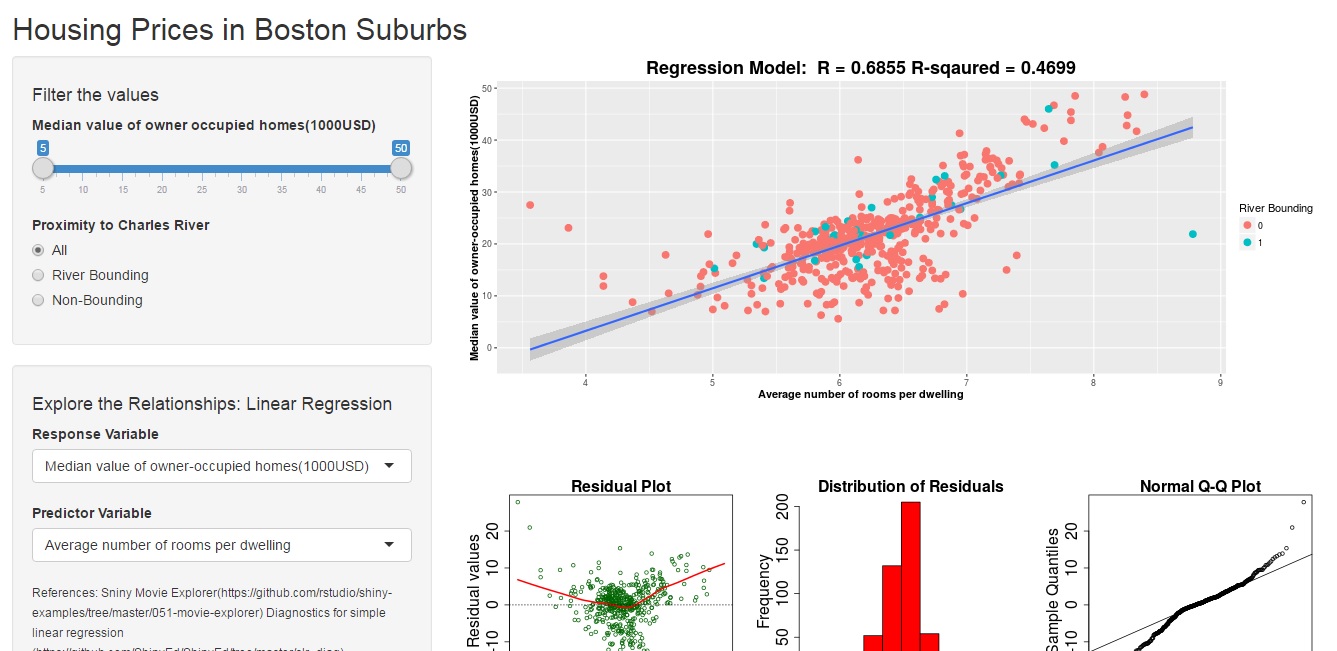
A shiny app that allows the user to explore the factors affecting the housing prices in Boston by analyzing relationships between them using Linear Regression Model Fitting and Residual Anaysis in R.
Statistical Models Regression R ShinyView Application
Crime Against Women in India
An Exploratory Analysis
The data regarding crimes against women was taken from Open Government Data Platform, India which is being maintained by National Informatics Centre (NIC), Department of Electronics & Information Technology, Ministry of Communications & Information Technology, falling under Government of India. This data was then analyzed to determine the nature of crime committed against women in different states within India
Data Analysis Social Change R Tableau User StudyView Project Download Report
TriPlanner
Web Application Tool for Trip Planning
A project utilizing Google Drive API, DropBox API and ItemMirror API to manage all the data related to trips and travel present in different storage areas to facilitate easy trip planning and sharing.
Web Application Data Management Google Drive API Dropbox APIView Project
